NexoBot
A cybersecurity investigation agent, and the monitoring that tells you it's working
DEPI Round 4 graduation project · Team of 3 · Nov 2025 – Jul 2026
What it is
NexoBot is a Tier-1 forensic investigation assistant. It reviews logs and code for security issues and runs eight investigation tools — CVE lookup, IP reputation, WHOIS, DNS records, VirusTotal, Shodan, MalwareBazaar and URL scanning — through a LangGraph agent that decides which to call. The model is a Qwen3-4B fine-tuned on a cybersecurity dataset with QLoRA and served locally in GGUF through llama.cpp, so security logs never leave the machine they're being analysed on.
Three people built it over eight months. Basil Mohamed fine-tuned and published the model. Ali Islam built the FastAPI backend, the database schema and migrations, and the agent tooling. I built the frontend foundation and the entire deployment and observability layer.
What I built
The React chat interface from scratch — the message stream over SSE, session handling, the sidebar, and the base styling.
Then the part this case study is actually about: the deployment and observability layer. Docker Compose orchestrating every service, Dockerfiles for backend and frontend, the Nginx layer, a GPU override for CUDA inference, Prometheus instrumentation inside the backend, and the Grafana dashboard.
The authentication UI, JWT session management, the tool status bar and file upload were Ali's work, not mine.
The question nobody had answered
A normal web application either responds or it doesn't. That's easy to check.
An LLM service has failure modes that don't look like failures. The model can be saturated and quietly turning requests away. A stream can open, deliver nothing, and close without ever raising an error. Generation can be running, but so slowly the service is effectively down. Standard HTTP monitoring sees a 200 response and reports that everything is fine.
So I instrumented for the failures that don't announce themselves.
The metrics, and why each one exists
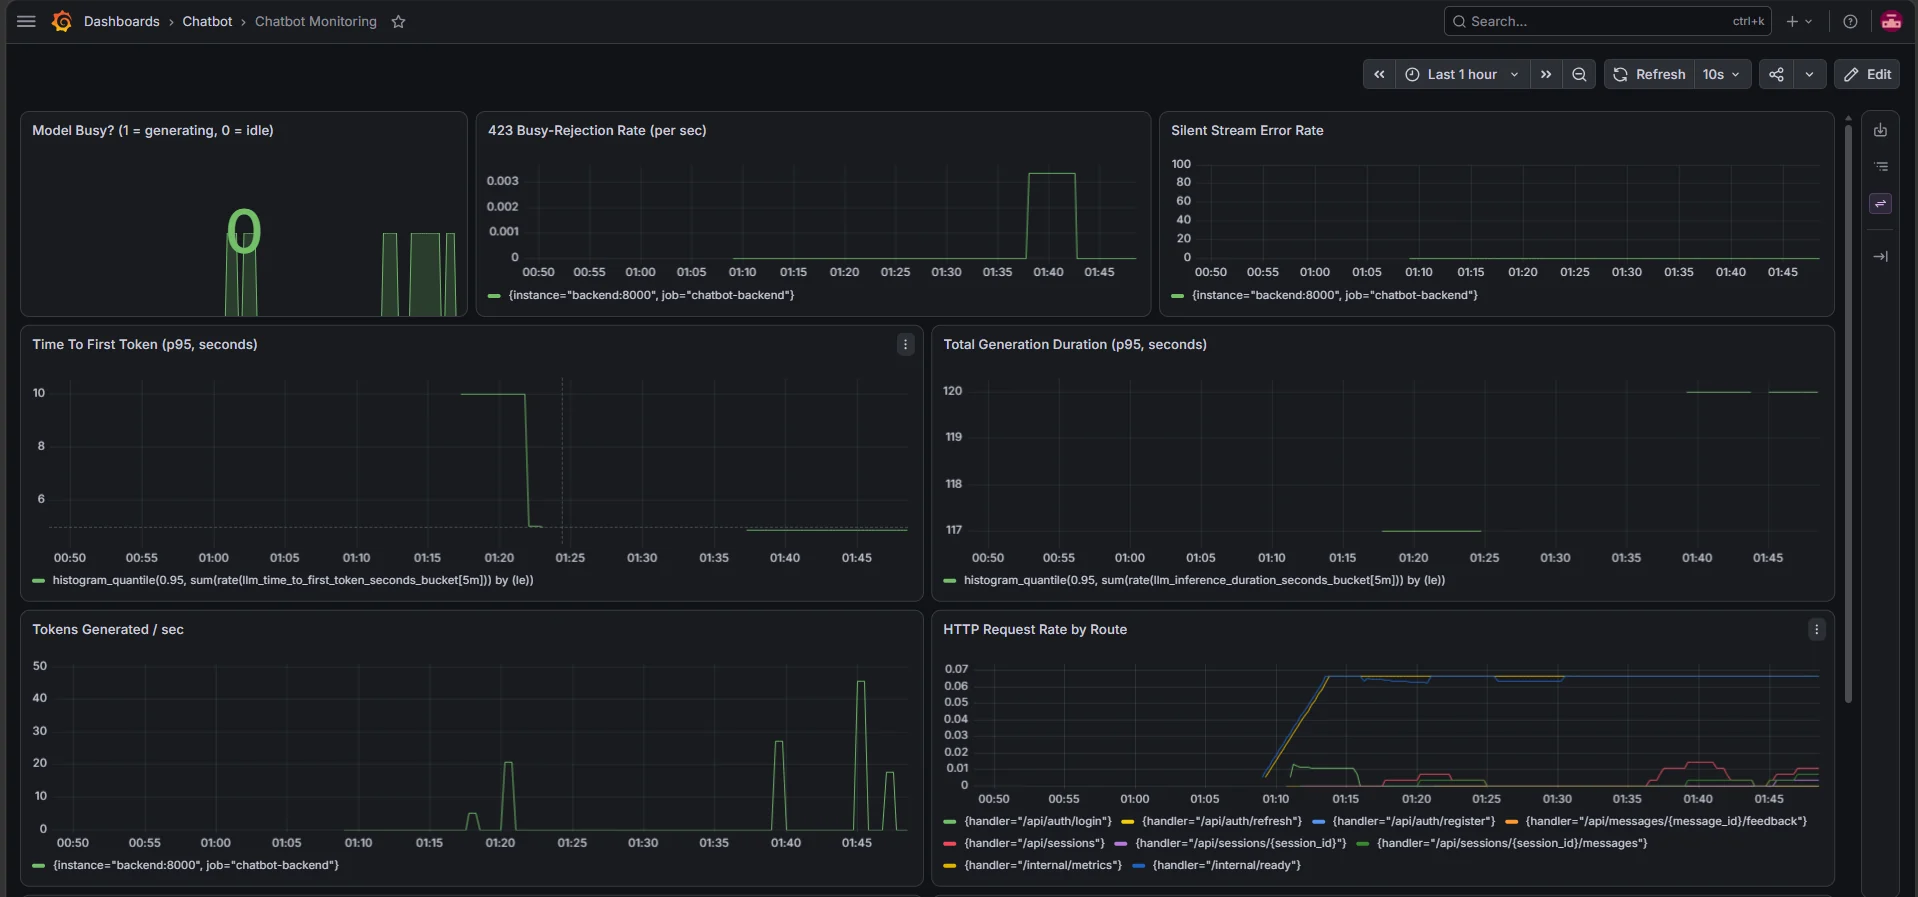
Model Busy (1/0)
Is the model generating right now, or idle?
423 Busy-Rejection Rate
How many requests are being turned away under load — is backpressure working, or is the service saturated?
Silent Stream Error Rate
How many SSE streams terminated without delivering anything? This is the failure that returns HTTP 200.
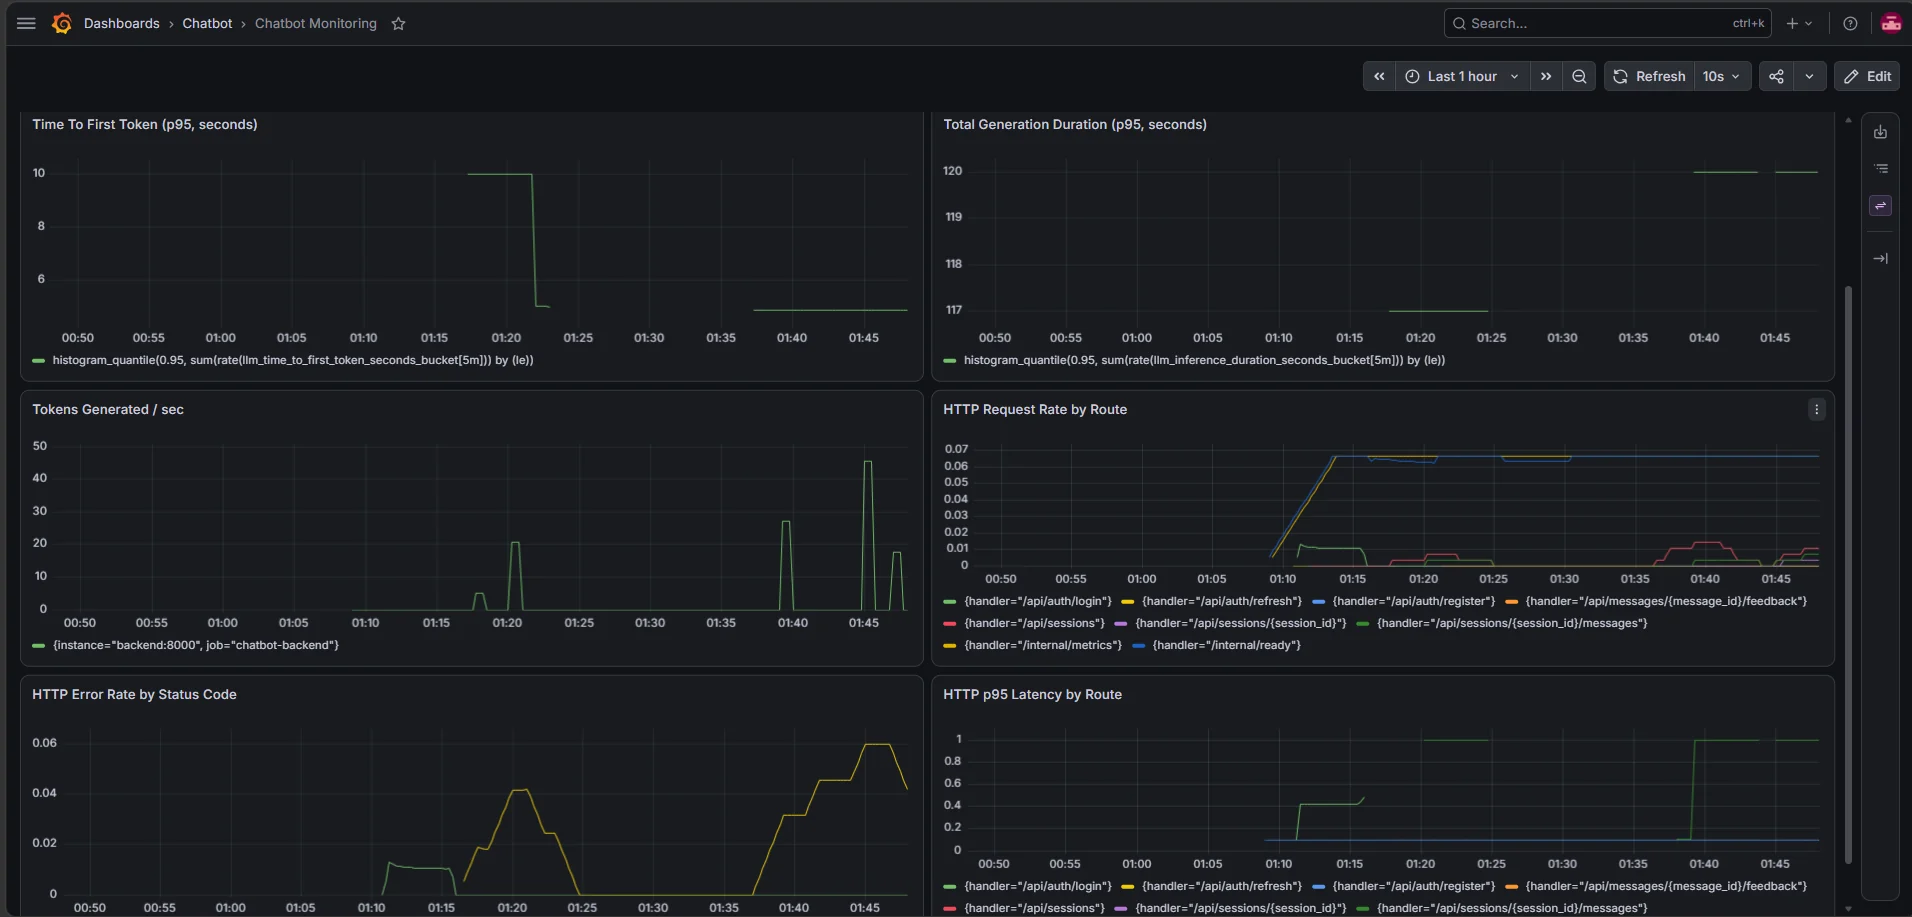
Time To First Token (p95)
How responsive does it feel before any text appears?
Total Generation Duration (p95)
What does a complete answer actually cost?
Tokens Generated / sec
Throughput.
HTTP rate, errors, p95 latency — by route
Standard RED metrics, so a slow endpoint can be told apart from a slow model.
Latency is measured as histogram quantiles over Prometheus buckets, not as averages. An average latency figure on an LLM endpoint hides precisely the tail you need to see.
What the numbers say
Time-to-first-token p95 sits near 10 seconds, and full generation near two minutes — running a quantised 4B model locally on consumer hardware, with no dedicated inference server.
Those are not good latency figures. They are the honest ones, and knowing them is the entire point: the slowness is the price of keeping security logs on the machine instead of shipping them to a hosted API. You cannot reason about a trade-off you have never measured.
The busy-rejection panel fires under concurrent load, which confirmed the backpressure path actually rejects rather than silently queueing. Per-route latency and error rate made it possible to distinguish a slow model from a slow endpoint — before the instrumentation, both looked identical from outside.
What I'd do differently
Add alerting rules, not just dashboards. A dashboard tells you something is wrong when you happen to be looking at it.